Histograms
When I process images in C1, I see several different histograms and they can sometimes all be different. What I found on one particular photo is that the exposure evaluation histogram and the levels histogram both show the red channel within the limits whereas the actual histogram shows the red channel completely blown out and off the edge of the histogram. No adjustment has been made in the levels tool. What’s going on? I have read other posts which suggest the main histogram tool also takes into account the output recipe selected and so I’m wondering whether in this instance that because I have an srgb output set it is showing me that the reds fall outside of my output colour space whereas the other histograms aren’t taking the srgb into account. Is that right?
-
Yes, the histogram does depend on the process recipe currently selected. Here are two screen shots showing the histogram tool and the exposure evaluation tool for the same image, and also showing the process recipe selected. As you'll see, the exposure evaluation graph is identical for both, but the Histogram is different for the JPG recipe compared with the one for the TIFF recipe.
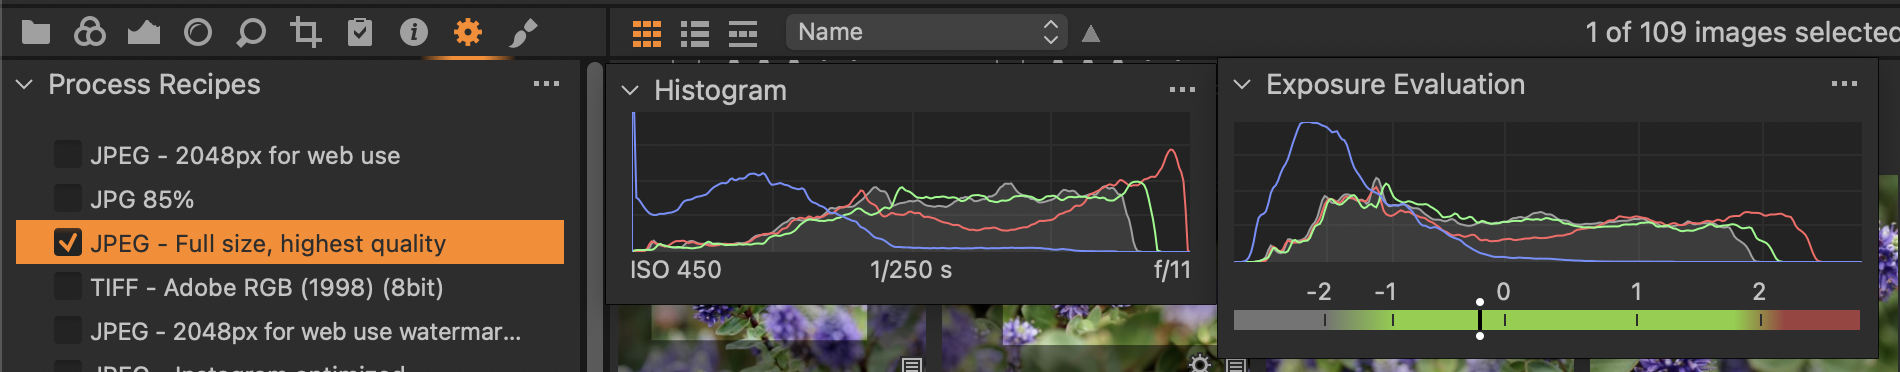
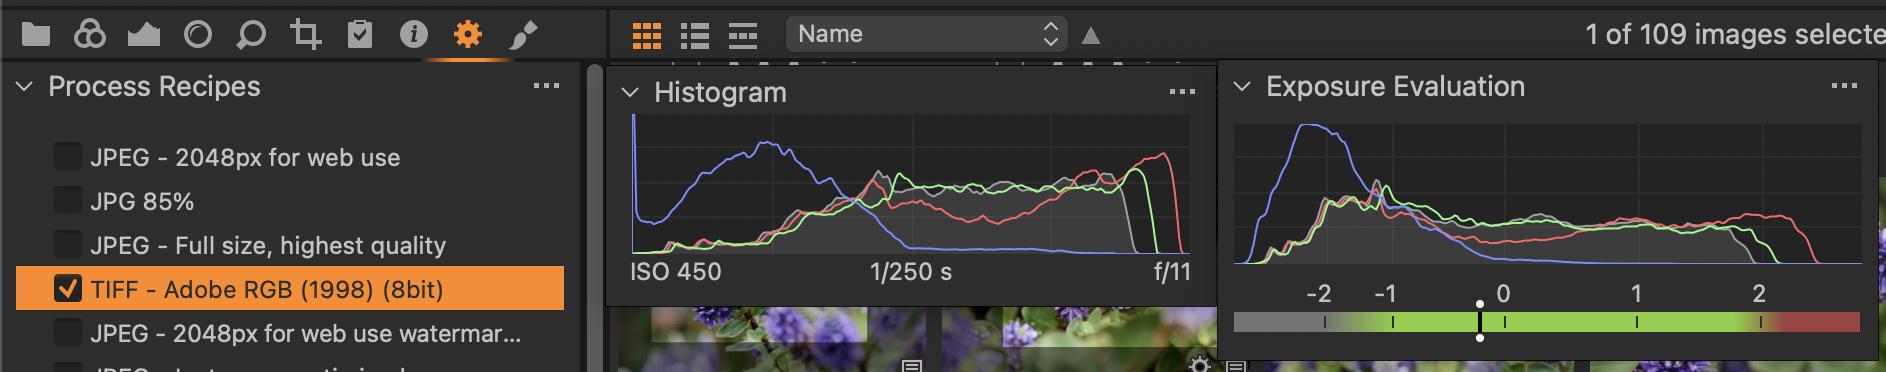
Ian
0 -

Thank you Ian. That does explain a lot. I have an srgb monitor and I mainly just output for web so I keep it all set to srgb. Would I be better off using Adobe RGB. I know several people that do.
0 -
No, if you output for the web, it's best to use sRGB.
Ian
0

Post is closed for comments.
Comments
3 comments